Fewer year-to-date traffic fatalities counterweighed by fewer vehicles on the road
Posted on Nov 25, 2020 in Highways News, Main, NewsHONOLULU – The Hawaii Department of Transportation (HDOT) reports that there have been 27 fewer deaths on Hawaii roads compared to this time in 2019. However, traffic volumes, or the amount of vehicle trips on the roads, has also been greatly decreased due to various orders related to the current pandemic.
“At HDOT, we are thankful that there have been fewer traffic deaths in 2020 but we also have to be mindful that we had fewer cars out on our roads,” said Hawaii Department of Transportation Deputy Director for Highways Ed Sniffen. “We know we need to continue pursuing safety measures, including education and support of enforcement, for the safety of everyone, pedestrians, bicyclists, motorcyclists, motorists, and their passengers.”
As of Nov. 24, 2020, there have been 73 traffic fatalities and multiple near fatal crashes. This is even with a reduction of roughly a third of vehicle trips daily. HDOT has been tracking the change in traffic volumes during the COVID-19 emergency at https://hidot.hawaii.gov/highways/covid-19-traffic-volume-comparison/
Top contributing factors involved in Hawaii traffic fatalities are impaired driving, speed, and distracted driving (Note: a traffic crash may have more than one contributing factor). Preliminary 2019 figures show 59-percent of the traffic fatalities that were tested, tested positive for alcohol and/or drugs. Of the 15 fatalities of persons between the ages of 15 to 22, 13 posthumously tested positive for alcohol and/or drugs.
Preliminary data for 2020 year-to-date shows that 47-percent of fatal crashes involved speed. This tracks with data that shows an average of 46-percent of fatal crashes in Hawaii since 2012 were related to speed.
On the engineering side, HDOT has been pursuing installation of raised pedestrian crosswalks, also known as speed tables, to elevate pedestrians and require drivers to slow when approaching the crosswalk. These improvements change behavior by requiring vehicles to travel at a responsible speed at the crossing every time.
Completed and planned installations of raised crosswalks by island are:
Kauai
- Kuhio Highway (Route 560) at mile marker 3.1 near Hanalei School – Installation planned for December 2020
Oahu
- Kalihi Street near Kalakaua Intermediate, Kalihi Kai Elementary – Installed May 2019
- Farrington Highway at Ala Walua Street, the Waianae High School exit, Alawa Place, and Maiuu Road – Installed August 2019
- Fort Weaver Road near Ilima Intermediate, Pohakea Elementary and James Campbell High Schools – Installed August 2019
- Farrington Highway by Waialua High School – Installed July 2020
- Pali Highway in Nuuanu at Upper Dowsett Avenue and Ahipuu Street – Installation planned for November/December 2020
- Fort Weaver Road at Parish Drive and Kiliha Street/Ewa Beach Road – Installation planned in addition to expansion of school zone speed zone and improved highway lighting
Maui
- Hana Highway near Haiku Elementary and Haiku Community Center – Installed two raised crosswalks in October 2020 to supplement Rapid Rectangular Flashing Beacons (RRFB) and speed feedback signs
- Haleakala Highway near Lower Kimo Drive – Installed two speed tables as a traffic calming measure. The speed limit on Haleakala is 30 mph with advisory speeds of 15 mph over the speed tables.
Hawaii Island
- Mamalahoa Highway (Route 11) at Naalehu School – Installation planned for December 2020
HDOT urges all drivers to follow the rules of the road for their own safety and the health and safety of our communities. Additional graphs showing impact of speeding on reaction times and survivability, fatalities involving speeding, and fatalities by crash type follow.
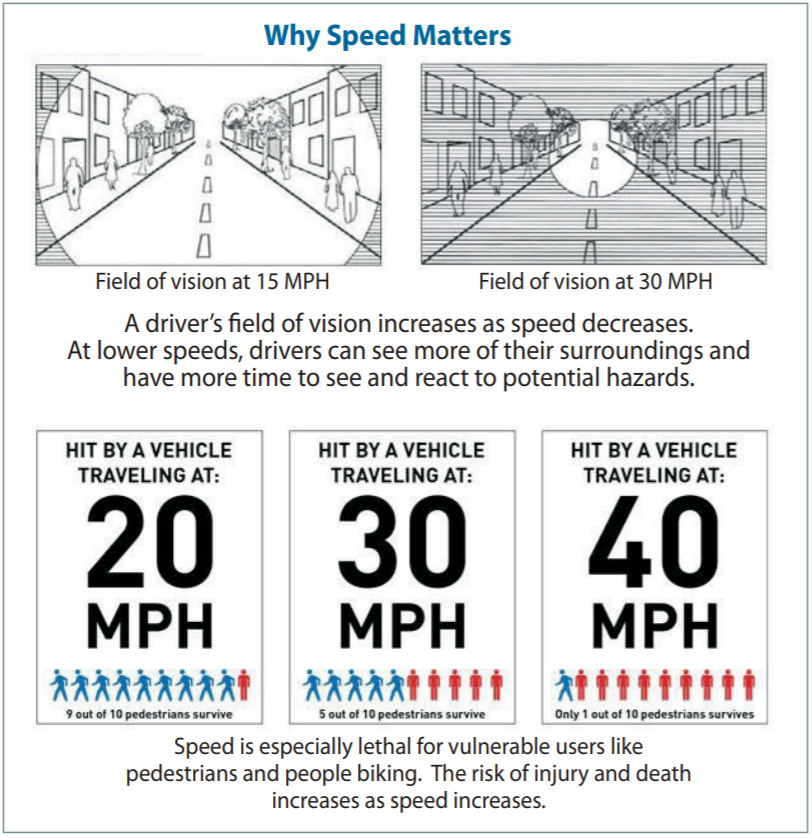
Graphic from https://www.seattle.gov/transportation/projects-and-programs/safety-first/vision-zero/speedlimits
Traffic Fatality Statistics
| Year | Hawaii Speed-related fatalities | Total Fatalities | Percentage Speed-related fatalities |
| 2012 | 69 | 125 | 55% |
| 2013 | 45 | 102 | 44% |
| 2014 | 36 | 95 | 38% |
| 2015 | 41 | 93 | 44% |
| 2016 | 54 | 120 | 45% |
| 2017 | 51 | 107 | 48% |
| 2018 | 51 | 117 | 44% |
| 2019 | 52 | 108 | 48% |
| 2020 (preliminary YTD) | 34 | 72 | 47% |
January 1, 2020 through November 24, 2020
| Motor Vehicle Occupants |
Pedestrians |
M/C, Moped, Scooter Operators |
Bicyclists |
ATV
Operators
|
TOTAL |
|
| C&C of Honolulu |
25 |
14 |
4 – m/c’s
1 – moped 0 – scooters Total – 5 |
4 |
47 |
|
| Hawaii County |
9 |
3 |
2 – m/c’s
0 – moped 0 – scooters Total – 2 |
14 |
||
| Maui County |
1 |
2 |
2 – m/c’s
0 – mopeds 0 – scooters Total – 2 |
5 |
||
| Kauai County |
3 |
2 – m/c’s
1 – mopeds 0 – scooters Total – 3 |
6 |
|||
|
TOTAL |
38 |
19 |
12 |
4 |
73 |
January 1, 2019 through November 25, 2019
| Motor Vehicle Occupants |
Pedestrians |
M/C, Moped, Scooter Operators |
Bicyclists |
ATV
Operators
|
TOTAL |
|
| C&C of Honolulu |
14 |
19 |
8 – m/c’s
3 – moped 0 – scooters Total – 11 |
2 |
46 |
|
| Hawaii County |
9 |
7 |
6 – m/c’s
0 – moped 0 – scooters Total – 6 |
1 |
23 |
|
| Maui County |
12 |
7 |
1 – m/c’s
1 – mopeds 0 – scooters Total – 2 |
21 |
||
| Kauai County |
7 |
2 |
1 – m/c’s
0 – mopeds 0 – scooters Total – 1 |
10 |
||
|
TOTAL |
42 |
35 |
20 |
3 |
100 |
###